 GOLDSNIPER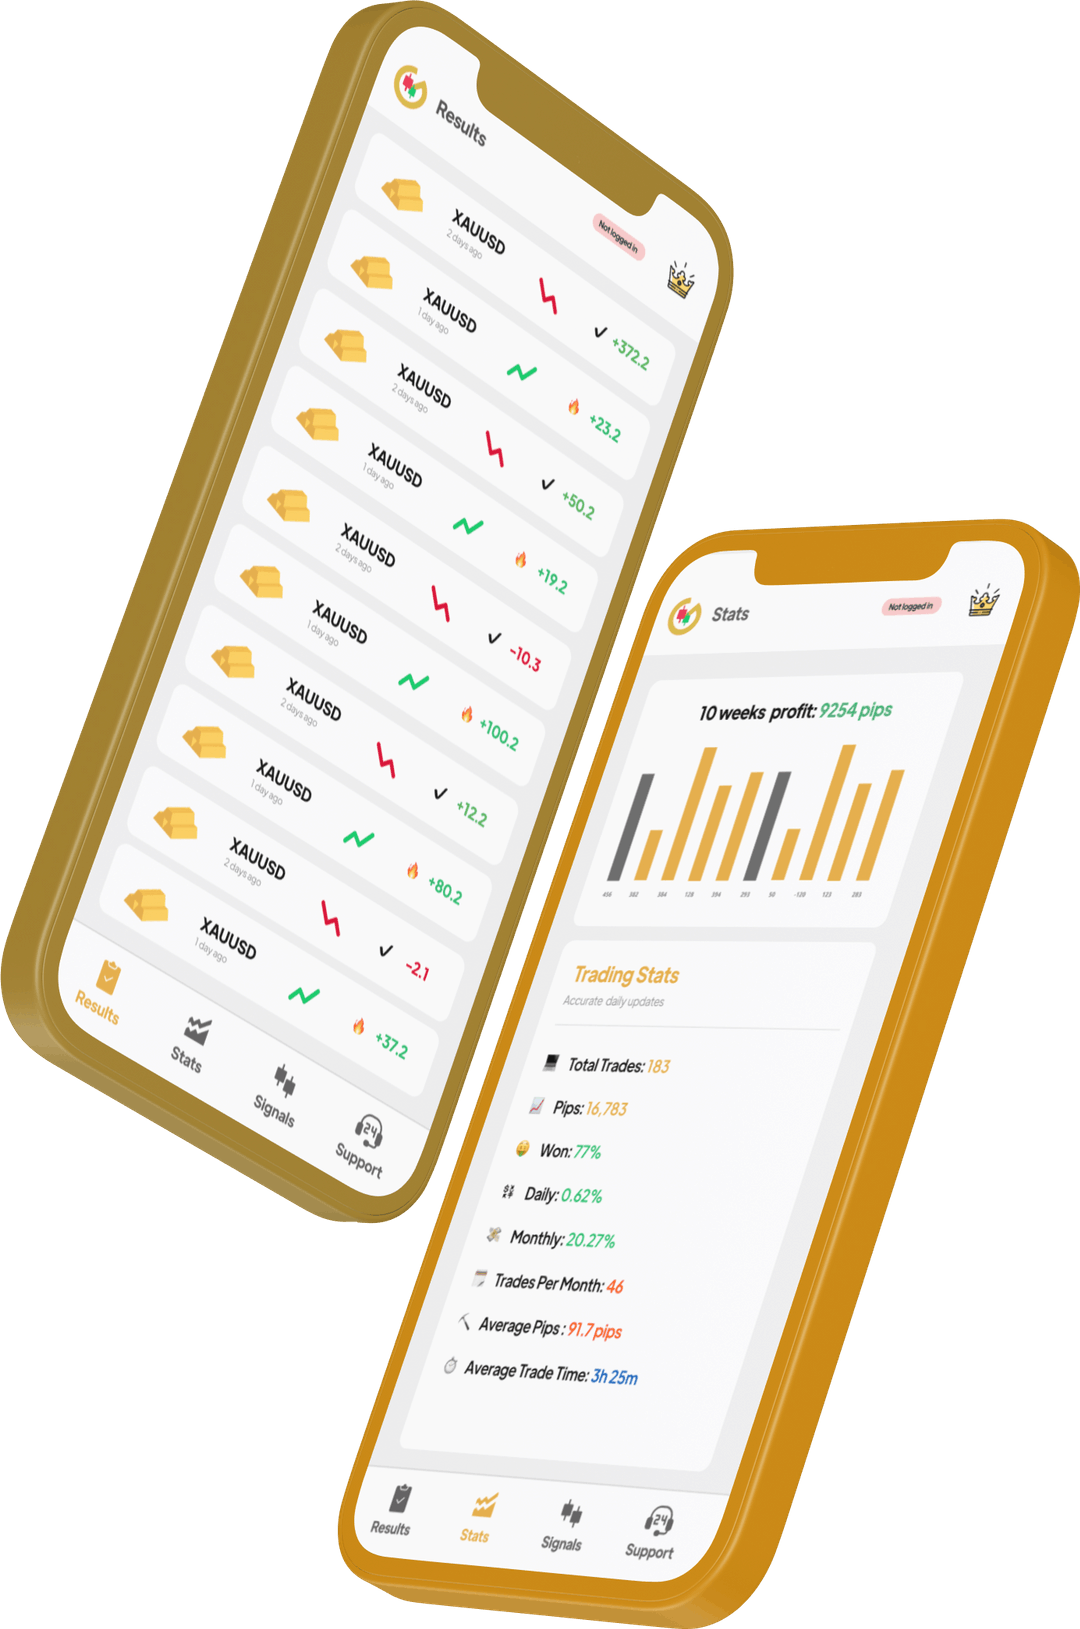
Gold (XAU/USD) and silver (XAG/USD) are the dominant precious metals for retail traders, but they offer fundamentally different trading experiences. Gold trades with spreads as low as $0.30 per ounce and daily ranges of $30–50, making it ideal for technical traders. Silver's spreads of $0.03 per ounce may seem cheaper, but as a percentage of price they're actually 10x wider. Gold's daily trading volume exceeds $150 billion versus silver's $5–10 billion — liquidity that translates directly into tighter fills and less slippage. GoldSniper focuses on gold signals precisely because of these structural advantages.
Key differences between gold and silver.
- › Spread: $0.30/oz (0.01% of price at $3,000)
- › Daily range: $30–50 (1.0–1.7% of price)
- › Daily volume: $150–200 billion
- › Margin requirement: ~$1,000–2,000 per standard lot
- › Primary drivers: real rates, USD, geopolitics
- › Role: pure monetary metal / safe haven
- › Volatility: 15–20% annualized
- › Spread: $0.03/oz (0.12% of price at $25)
- › Daily range: $0.50–1.00 (2.0–4.0% of price)
- › Daily volume: $5–10 billion
- › Margin requirement: ~$500–1,000 per standard lot
- › Primary drivers: industrial demand, gold, USD
- › Role: dual monetary + industrial metal
- › Volatility: 30–40% annualized
The most important difference for traders: gold's spread as a percentage of price is roughly 10x tighter than silver's. At $3,000/oz, gold's $0.30 spread is 0.01% — you need just a few cents of favorable movement to cover costs. At $25/oz, silver's $0.03 spread is 0.12% — you need a much larger move just to break even. This makes gold significantly more efficient for short-term and intraday trading strategies.
Which is better for day trading?
For day traders, gold is the clear winner in almost every category that matters. Gold's daily range of $30–50 (1.0–1.7%) provides consistent opportunity without the erratic whipsaws that plague silver. A $40 move in gold represents a potential 4,000 pips — massive profit potential from a single day's range. Silver's daily range of $0.50–1.00 may seem tight in dollar terms, but at 2–4% of price it's actually more volatile percentage-wise — meaning your stops are more likely to get hit by noise.
Spread cost comparison
Consider a trader making 5 round-trip trades per day. With gold at $3,000 and a $0.30 spread, total spread costs are $1.50 per ounce traded — roughly 0.05% of notional value. With silver at $25 and a $0.03 spread, total costs are $0.15 per ounce — but that's 0.60% of notional value, 12x higher as a percentage. Over 250 trading days, a silver day trader pays approximately 3% more in spread costs than a gold trader trading the same notional amount. That's a massive structural disadvantage.
Liquidity and slippage
Gold's $150–200 billion daily volume means market orders are filled within a fraction of a pip even during news events. Silver's $5–10 billion volume means liquidity can evaporate during volatile periods — spreads can widen to $0.05–0.10 during news, and stop-loss orders may experience significant slippage. For traders who use tight stop losses (5–15 pips), gold's superior liquidity is the difference between a stop being filled at the expected level versus being slipped by 5–10 additional pips on silver.
Technical patterns: cleaner on gold
Gold's price action tends to respect support and resistance levels more reliably than silver's. Because gold is primarily driven by macro forces (real interest rates, USD strength, central bank policy), its technical patterns are less noisy. Silver, with its dual industrial + monetary role, reacts to both macro events and industrial data (PMI, manufacturing orders), creating conflicting signals that produce false breakouts more frequently. Gold's cleaner technical structure is why GoldSniper's 93% signal accuracy is achievable — the patterns are more predictable.
Gold vs silver for long-term investing.
Over the past 20 years, gold has delivered approximately +340% total return versus silver's +290%. But this headline number obscures very different journeys. Gold compounded steadily with 15–20% annualized volatility; silver experienced violent swings of 30–40% annualized volatility with multiple 50%+ drawdowns. Gold went from $450 to $3,000+ with only two drawdowns exceeding 30% (2008 and 2013). Silver went from $7 to $25 with drawdowns of 72% (2011–2015) and 42% (2020–2022).
Understanding the gold-silver correlation.
Gold and silver maintain a strong positive correlation of 0.75–0.85 over rolling 12-month periods. When gold rallies on monetary policy or geopolitical concerns, silver almost always follows — often with amplified moves. When gold falls, silver typically falls harder. This creates both a risk and an opportunity for traders who monitor the relationship.
The gold-to-silver ratio
The gold-to-silver ratio — how many ounces of silver it takes to buy one ounce of gold — is one of the oldest trading indicators in precious metals. Historically ranging from 15:1 (Roman Empire) to 125:1 (March 2020 COVID panic), the modern average sits around 60:1. At 80:1 or above, silver is considered undervalued relative to gold and traders look for mean-reversion trades (short gold, long silver). At 50:1 or below, gold is relatively undervalued. As of mid-2026, the ratio has been trading in the 75–85 range, suggesting silver may have catch-up potential.
When the correlation breaks
The gold-silver correlation weakens during periods of extreme industrial stress or boom. During the 2020 COVID crash, silver initially fell far harder than gold (ratio spiked to 125:1) as industrial demand collapsed. During the 2021–2022 green energy push, silver outperformed gold as solar panel demand surged. In 2025–2026, the correlation has held reasonably well, but silver's industrial demand from solar manufacturing (which uses ~12% of annual silver supply) has provided a floor that gold doesn't have — creating periods where silver outperforms on industrial optimism even as gold trades sideways.
How to trade both metals effectively.
Gold as primary, silver as confirmation
Trade gold as your main precious metals instrument. Use silver's price action as a confirming indicator — if gold is breaking out but silver isn't following, the breakout may be false. When both metals confirm a move together, the probability of follow-through increases significantly.
Ratio mean-reversion trades
When the gold-to-silver ratio exceeds 85, consider ratio trades: short gold futures/CFDs while going long silver. Historically, ratios above 85 have reverted toward 70 within 6–12 months. Use a 2:1 position sizing ratio (2 units silver per 1 unit gold) to account for volatility differences.
Risk management differences
Silver requires wider stops relative to gold. If you use a 15-pip stop on gold, you should consider a 25–30 pip stop on silver to account for its higher percentage volatility and wider spreads. Position size silver at 50–60% of your gold position size for equivalent risk exposure.
Session timing matters
Gold liquidity peaks during the London (8:00–17:00 GMT) and US (13:00–22:00 GMT) sessions. Silver sees additional volume during Asian hours due to industrial demand from Chinese manufacturing. The London/NY overlap (13:00–17:00 GMT) is the prime window for both metals.
Gold vs silver trading strategies.
See how our analysts approach both metals for maximum returns.
Explore more
Trade gold with 93% signal accuracy.
GoldSniper focuses on XAU/USD for its superior liquidity and predictable patterns. Download free.